Giveaway: https://www.tradepub.com/free/w_pacc26/
Any DRM Removal for Win 20% OFF
Epubor Ultimate for Win 20% OFF
Epubor Audible Converter for Win 20% OFF
Epubor eBook Converter for Win 20% OFF
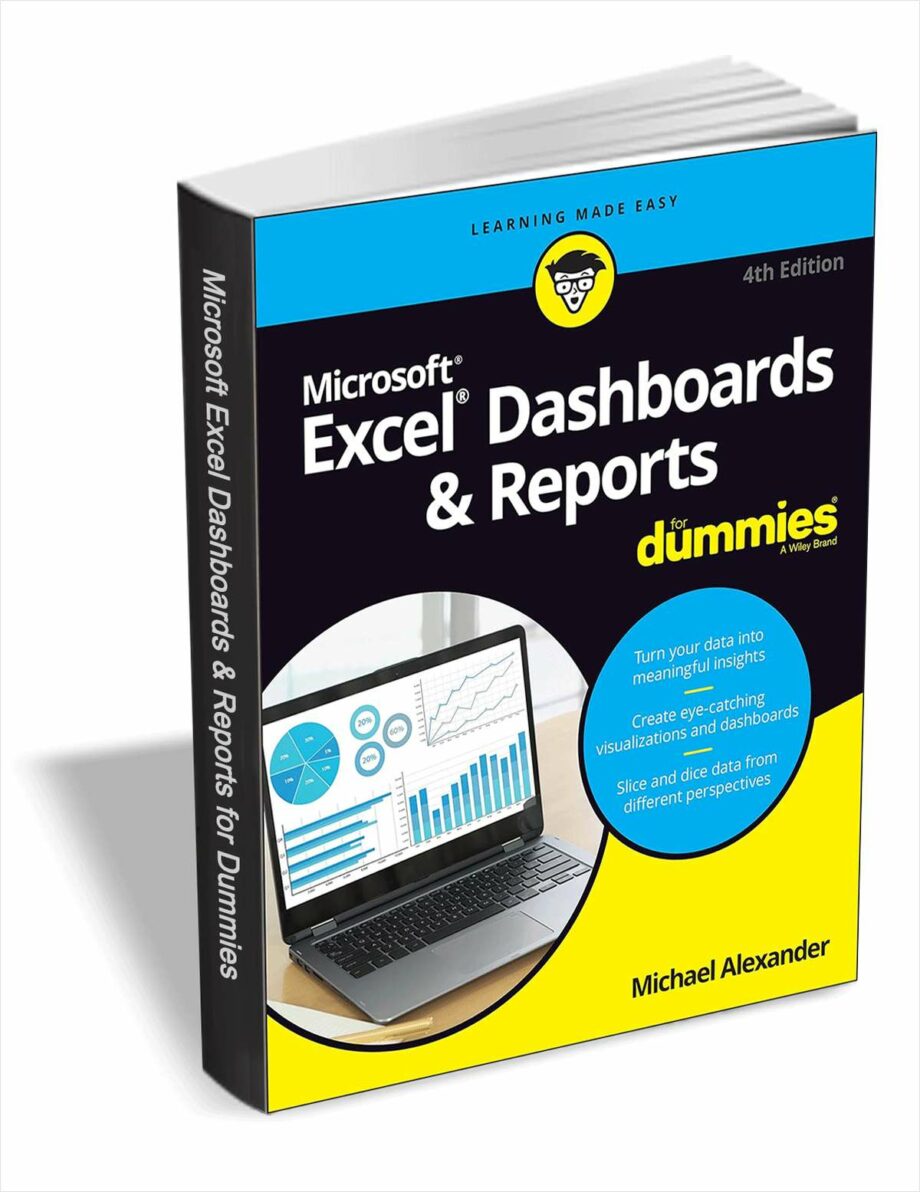
Excel Dashboards & Reports For Dummies, 4th Edition by Michael Alexander can be a valuable resource for anyone who wants to transform their spreadsheets into dynamic and informative dashboards and reports using Microsoft Excel. Here's a closer look at the book to help you decide if it's the right fit for you:
Potential Benefits:
Clear and Concise: Written in the approachable For Dummies style, the book uses plain language and avoids complex technical jargon.
Covers Latest Features: The 4th edition ensures you're getting information on the most recent functionalities available in Microsoft Excel provided through Microsoft 365 subscriptions.
Step-by-Step Tutorials: The book guides you through the process of creating dashboards and reports with clear instructions and practical examples.
Focus on Practical Application: It emphasizes real-world applications, helping you learn how to use Excel dashboards and reports to effectively communicate data insights.
Variety of Techniques: You'll explore various techniques for data visualization, formatting, automation strategies, and even using external data sources for your reports.
Points to Consider:
Assumes Basic Excel Knowledge: While the book explains concepts clearly, it assumes you have a foundational understanding of using Microsoft Excel.
Limited Scripting: If you're looking for in-depth VBA scripting (a programming language used to automate tasks within Excel), this book might not cover it extensively. For advanced automation, you might need to consult additional resources.
Who Can Benefit:
Excel Users Who Want to Create Impactful Reports: If you're comfortable with Excel but want to elevate your reporting skills and create visually appealing and informative dashboards, this book can be a great starting point.
Business Professionals: Business analysts, project managers, and anyone who needs to present data-driven insights can benefit from learning how to create compelling reports in Excel.
Alternatives:
Online Tutorials: There are numerous online tutorials and courses available that can teach you Excel dashboard and report creation.
Microsoft Documentation: Microsoft itself offers comprehensive documentation on Excel functionalities, including features related to data visualization and reporting.


